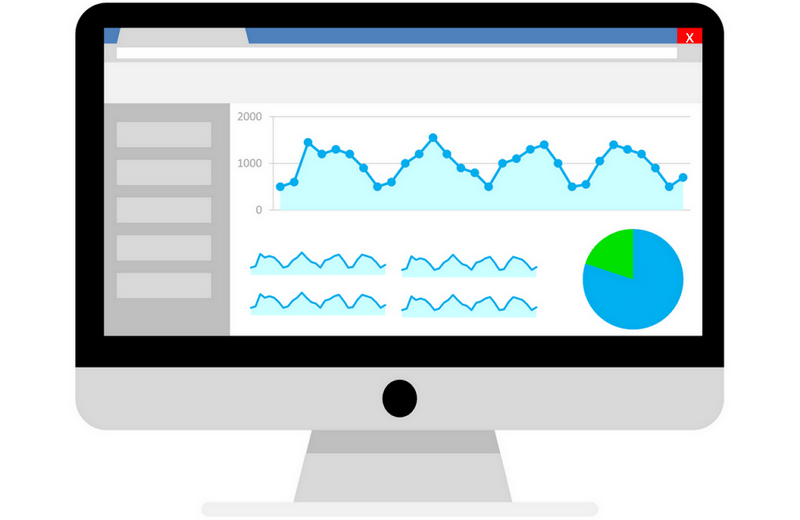
Analytics is monstrously powerful. It is always important to collect information about strengths and weaknesses of your website, retrieve audience and sessions data, understand how popular your site is at the moment and form the idea of how to boost its popularity in the future. Google Analytics is a perfect choice to collect information about important segments of your site. Let’s take a closer look at its amazing features.
First of all, log into your Google Analytics account. It’s trivial, but the most important task during all the work with Analytics. After you have logged in, you may see the left sidebar, which contains all the possible sets of data and reports.
The service provides the ability to choose the date range of the data you are currently working with. This feature grants the ability to check your website’s info within the specific timeline, check the results of advertisement campaigns or SEO improvements.
One of the most important metrics you can get is under the Audience report. This report will provide an overview of user and session behavior in the specific timeline (hour, day, week or month). You will find out the count of sessions, unique visitors, total page views, get the statistics based on the number of pages surfed per session, average session duration, bounce rate, etc… Bounce rate is a really powerful metric that shows the percentage of users, who just visit the page and leave. It is important to keep this value as low as possible to keep your site popular. Smart usage of bounce rate info can reveal some problems with the site’s appearance, design, SEO optimization or performance.
You may also take the advantages of such pieces of data as Interests and Behaviour. First one shows the information about the users’ listed preferences provided by Google. The behavior will highlight the path that visitors travel from one page to another. Use this data to make your site more attractive for new users and locale the «sweetest» parts on the most relevant pages to make the appeal even more powerful.
You may also be interested in the Acquisition segment. This metrics contains the information of how the new users find the website. The acquisition is divided into 4 categories:
1. Organic Search shows the data when the user has found the site by a search engine.
2. Referral method takes place when you post the link to your site on another site and someone clicks on it.
3. Social represents the visits from social media, like Facebook, Twitter, etc.
4. Direct is about the user directly types the address of your website in the browser.
This metric may have a huge impact by its ability to see the traffic sources. You can use this information to boost the least efficient sources or make the most relevant sources even more influential.

Google analytics is a powerful tool for product improvement. Check out the metrics, analyze the statistics and use the gathered information to make your site even more popular.


